Integrate Charts Region to Faceted Search using APEX_REGION.EXPORT_DATA API
Before you get into the details of this blog , I would like you to visit wonderful blog written by Carsten Czarski on "Adding Charts to Faceted Search" with different approach. This blog will help you to understand another possibilities available using different API. The main objective of this different technique is to assess performance improvement and I will try to post comparison of performance in future. At the same time, I will also wish if you all can share your experience as well by using this approach. Now, lets get back to our topic and explore it further.
You all are aware about Faceted Search and its powerful features. But, it still lacks some of the features which end users are looking for. E.g End user will expect to have ability to use faceted search region to filter chart region data. As of now , Chart Region does not support native integration with Faceted Search Region. But, APEX team has already provided useful APIs to achieve the same and I have used EXPORT_DATA API defined under package APEX_REGION to integrate charts into faceted search.
As a first step , Lets create a common procedure to get region data source in form of JSON and store into collection.
 create or replace procedure get_region_datasource
  (p_app_id in number, p_app_page_id in number , p_region_static_id in varchar2 )
 is
   lv_export    apex_data_export.t_export;
   lv_region_id  number;
 BEGIN
 APEX_COLLECTION.CREATE_OR_TRUNCATE_COLLECTION(p_collection_name => p_region_static_id);
 SELECT region_id into lv_region_id
   FROM apex_application_page_regions
   WHERE application_id = p_app_id and page_id = p_app_page_id and static_id = p_region_static_id;
 lv_export := apex_region.export_data (
      p_format    => apex_data_export.c_format_json,
      p_page_id   => p_app_page_id,
      p_region_id  => lv_region_id,
      p_as_clob => TRUE);
 APEX_COLLECTION.ADD_MEMBER(p_collection_name => p_region_static_id,P_CLOB001 => lv_export.content_clob);
 EXCEPTION
   WHEN OTHERS THEN
    raise;
 END get_region_datasource;
After creating a procedure, you can now create faceted search report page by choosing "EMP" table as below :

Now, run the page and check the output. It should contain four facets created by default selection while choosing the table. Then after , set STATIC_ID for classic report region as per below screenshot. This STATIC_ID will be used as one of the parameter to call procedure defined above.

Now, add chart region with following query. This query basically converts JSON output stored in the collection named as "EMP_DATA" into relational output. This collection stores the JSON text as CLOB using procedure [ GET_REGION_DATASOURCE ] created earlier.
with REGION_DATA_SOURCE as(
SELECT clob001 as JSON_DATA
FROM APEX_COLLECTIONS
WHERE COLLECTION_NAME = 'EMP_DATA')
select b.* from REGION_DATA_SOURCE a ,
       json_table( a.JSON_DATA FORMAT JSON , '$.items[*]'
           COLUMNS  (
                        ename VARCHAR2 PATH '$.ename',
                        sal   number PATH '$.sal'
                    )
             ) b

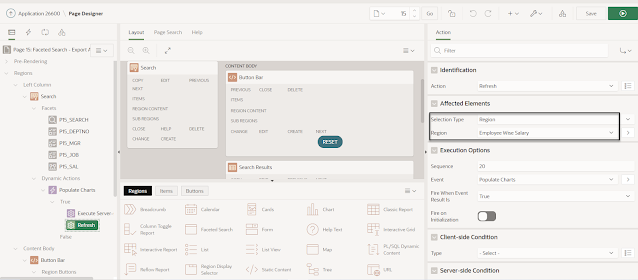
Here in below screen shot , You can see that we have passed three parameters in procedure to store JSON text which is exported as CLOB by "EXPORT_DATA" API into collection.

 |
- We are able to create generic procedure to fetch region data source. So, this can be used with Interactive Report and Interactive Grid as well.
- We don't have to submit page items for each region which needs to be integrated. E.g. You can have multiple chart regions on a page using same collection with different query result.
- It is very easy to use and hides complexity. And, I would like to see more generic standard API in future to have tight integration.
Very cool - thanks for sharing this.
ReplyDeleteGood Job!!
ReplyDeleteLooking forward to see more awesome blogposts from your side.
All the best!!
Excellent work
ReplyDeleteGood Job
Hi, thanks a lot for your tutorial! I have a very hard time to read the screenshots which contain important steps. Could you please upload the images in higher resolution or include the code / important step in the text? Thanks
ReplyDelete